Materiality Examples Across Industries
Updated:
January 13, 2026
·
[Read Time]
Knowing what to account for is often one of the most challenging aspects of carbon accounting. While Scope 3 emissions typically make up the majority of emissions across most industries, the sources of those emissions—often called “hotspots”—vary significantly by sector.
This variation is what makes Scope 3 accounting complex. There is no single approach that applies uniformly across industries. Instead, organizations must identify where emissions are most concentrated within their own value chain and tailor their data collection and reduction strategies accordingly.
To illustrate how Scope 3 emissions differ by industry, the examples below highlight common hotspots across three sectors.
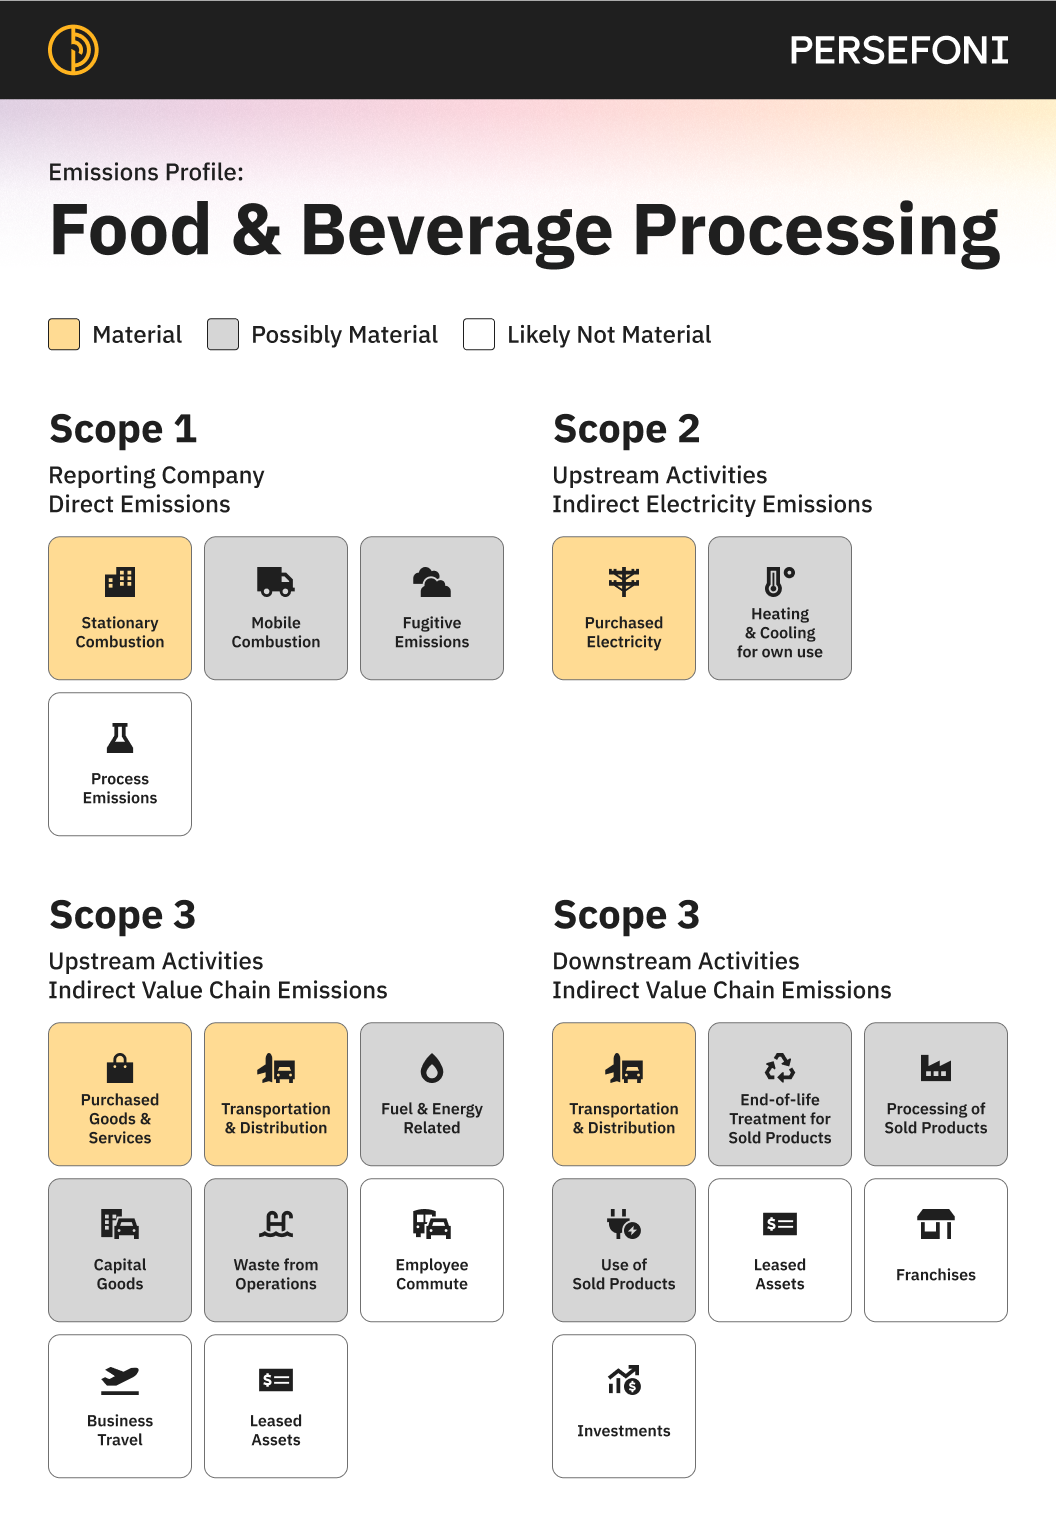
Primary Scope 3 hotspot: Purchased Goods and Services (Category 1)
In the food and beverage industry, purchased goods and services often dominate Scope 3 emissions. In the graphic below, purchased goods and services account for approximately 67% of total Scope 3 emissions, with the remaining emissions distributed across categories such as transportation and distribution, capital goods, and use of sold products.
This concentration is expected for the sector. Food and beverage companies rely heavily on agricultural inputs, raw ingredients, packaging materials, and processing services—all of which are emissions-intensive before products ever reach the company’s own operations.
Why this matters:
For food and beverage companies, improving Scope 3 data quality and reductions often starts with supplier engagement around ingredients, farming practices, and packaging materials.
Primary Scope 3 hotspot: Use of Sold Products (Category 11)
In vehicle manufacturing, the largest share of Scope 3 emissions typically comes from the use of sold products. Emissions from product use can account for approximately 84% of total Scope 3 emissions, far outweighing emissions from manufacturing, transportation, or capital goods.
While producing a vehicle is emissions-intensive, most emissions occur over the vehicle’s lifetime, as it consumes fuel or electricity during use.
Why this matters:
For automakers, Scope 3 strategies often focus on improving vehicle efficiency, electrification, and influencing how products are used, rather than only reducing emissions in manufacturing.
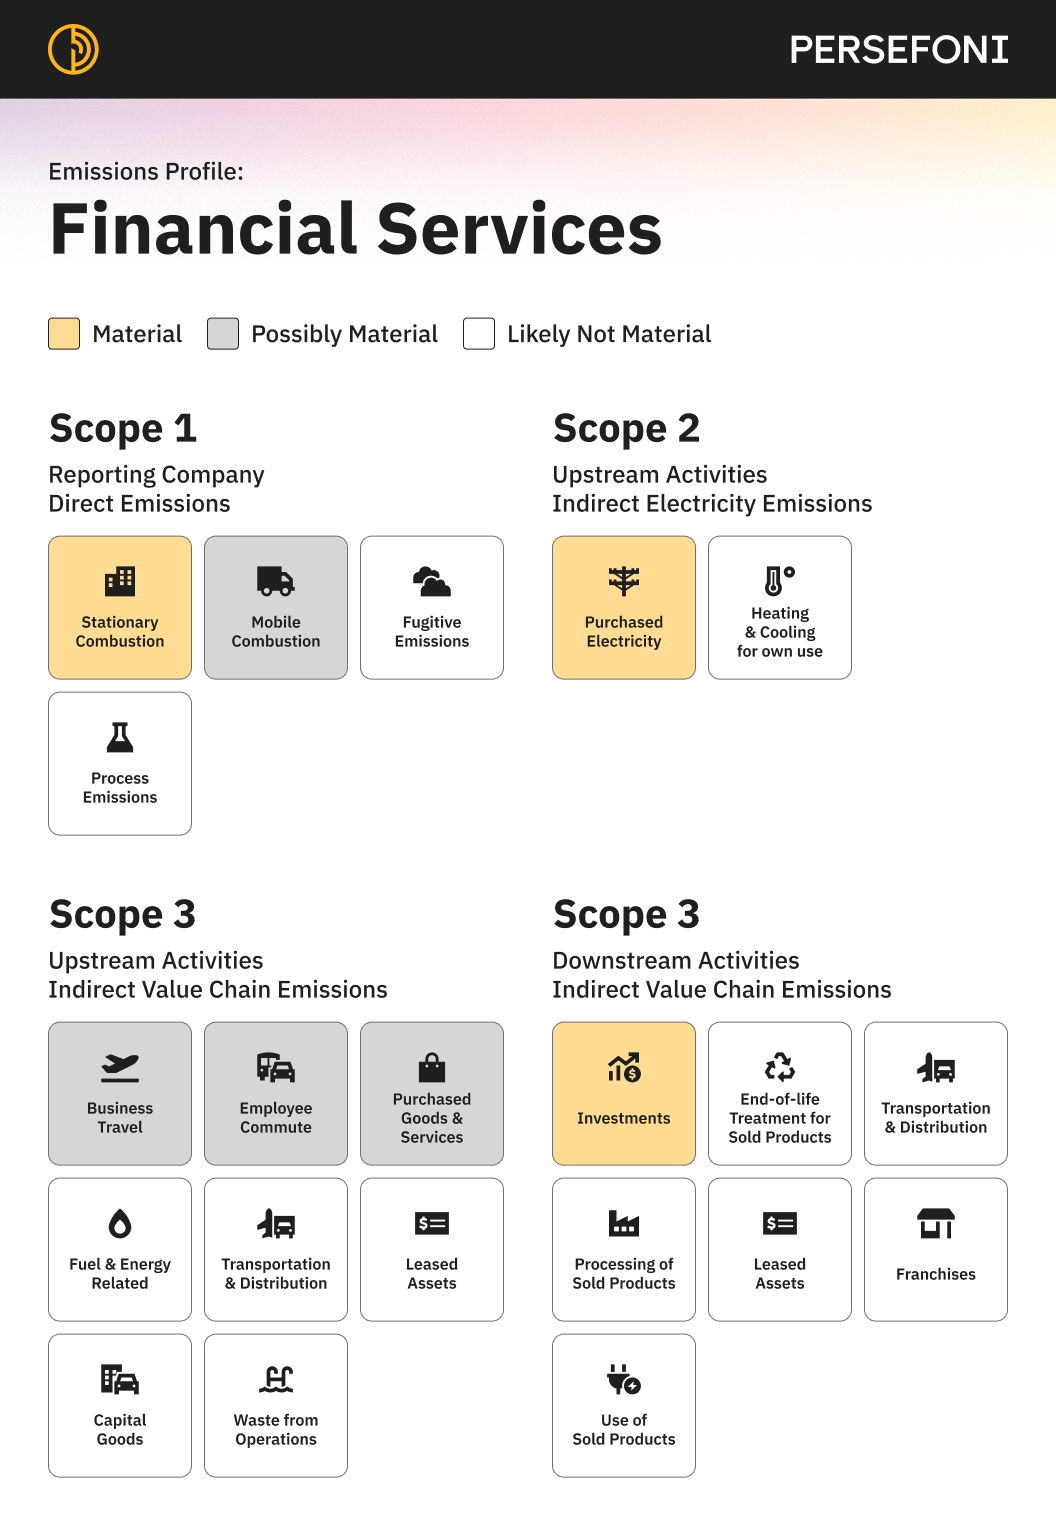
Primary Scope 3 hotspot: Investments (Category 15)
For financial institutions, the majority of emissions occur in Scope 3 Category 15: Investments rather than from direct operations. Operational emissions are typically limited to offices, data centers, and employee travel.
Instead, a financial institution’s climate impact is largely determined by the companies, projects, and assets it finances. Emissions associated with lending and investment portfolios often represent the overwhelming majority of the institution’s total carbon footprint.
Why this matters:
In financial services, Scope 3 accounting is central to risk management, portfolio analysis, and capital allocation decisions—not operational efficiency.
While Scope 3 emissions are material across nearly all industries, the drivers of those emissions differ dramatically by sector. Identifying industry-specific hotspots allows organizations to focus data collection and reduction efforts where they will have the greatest impact.
Understanding where emissions occur in the value chain is the first step toward building a practical, decision-useful Scope 3 inventory.
